Make this figure in Python
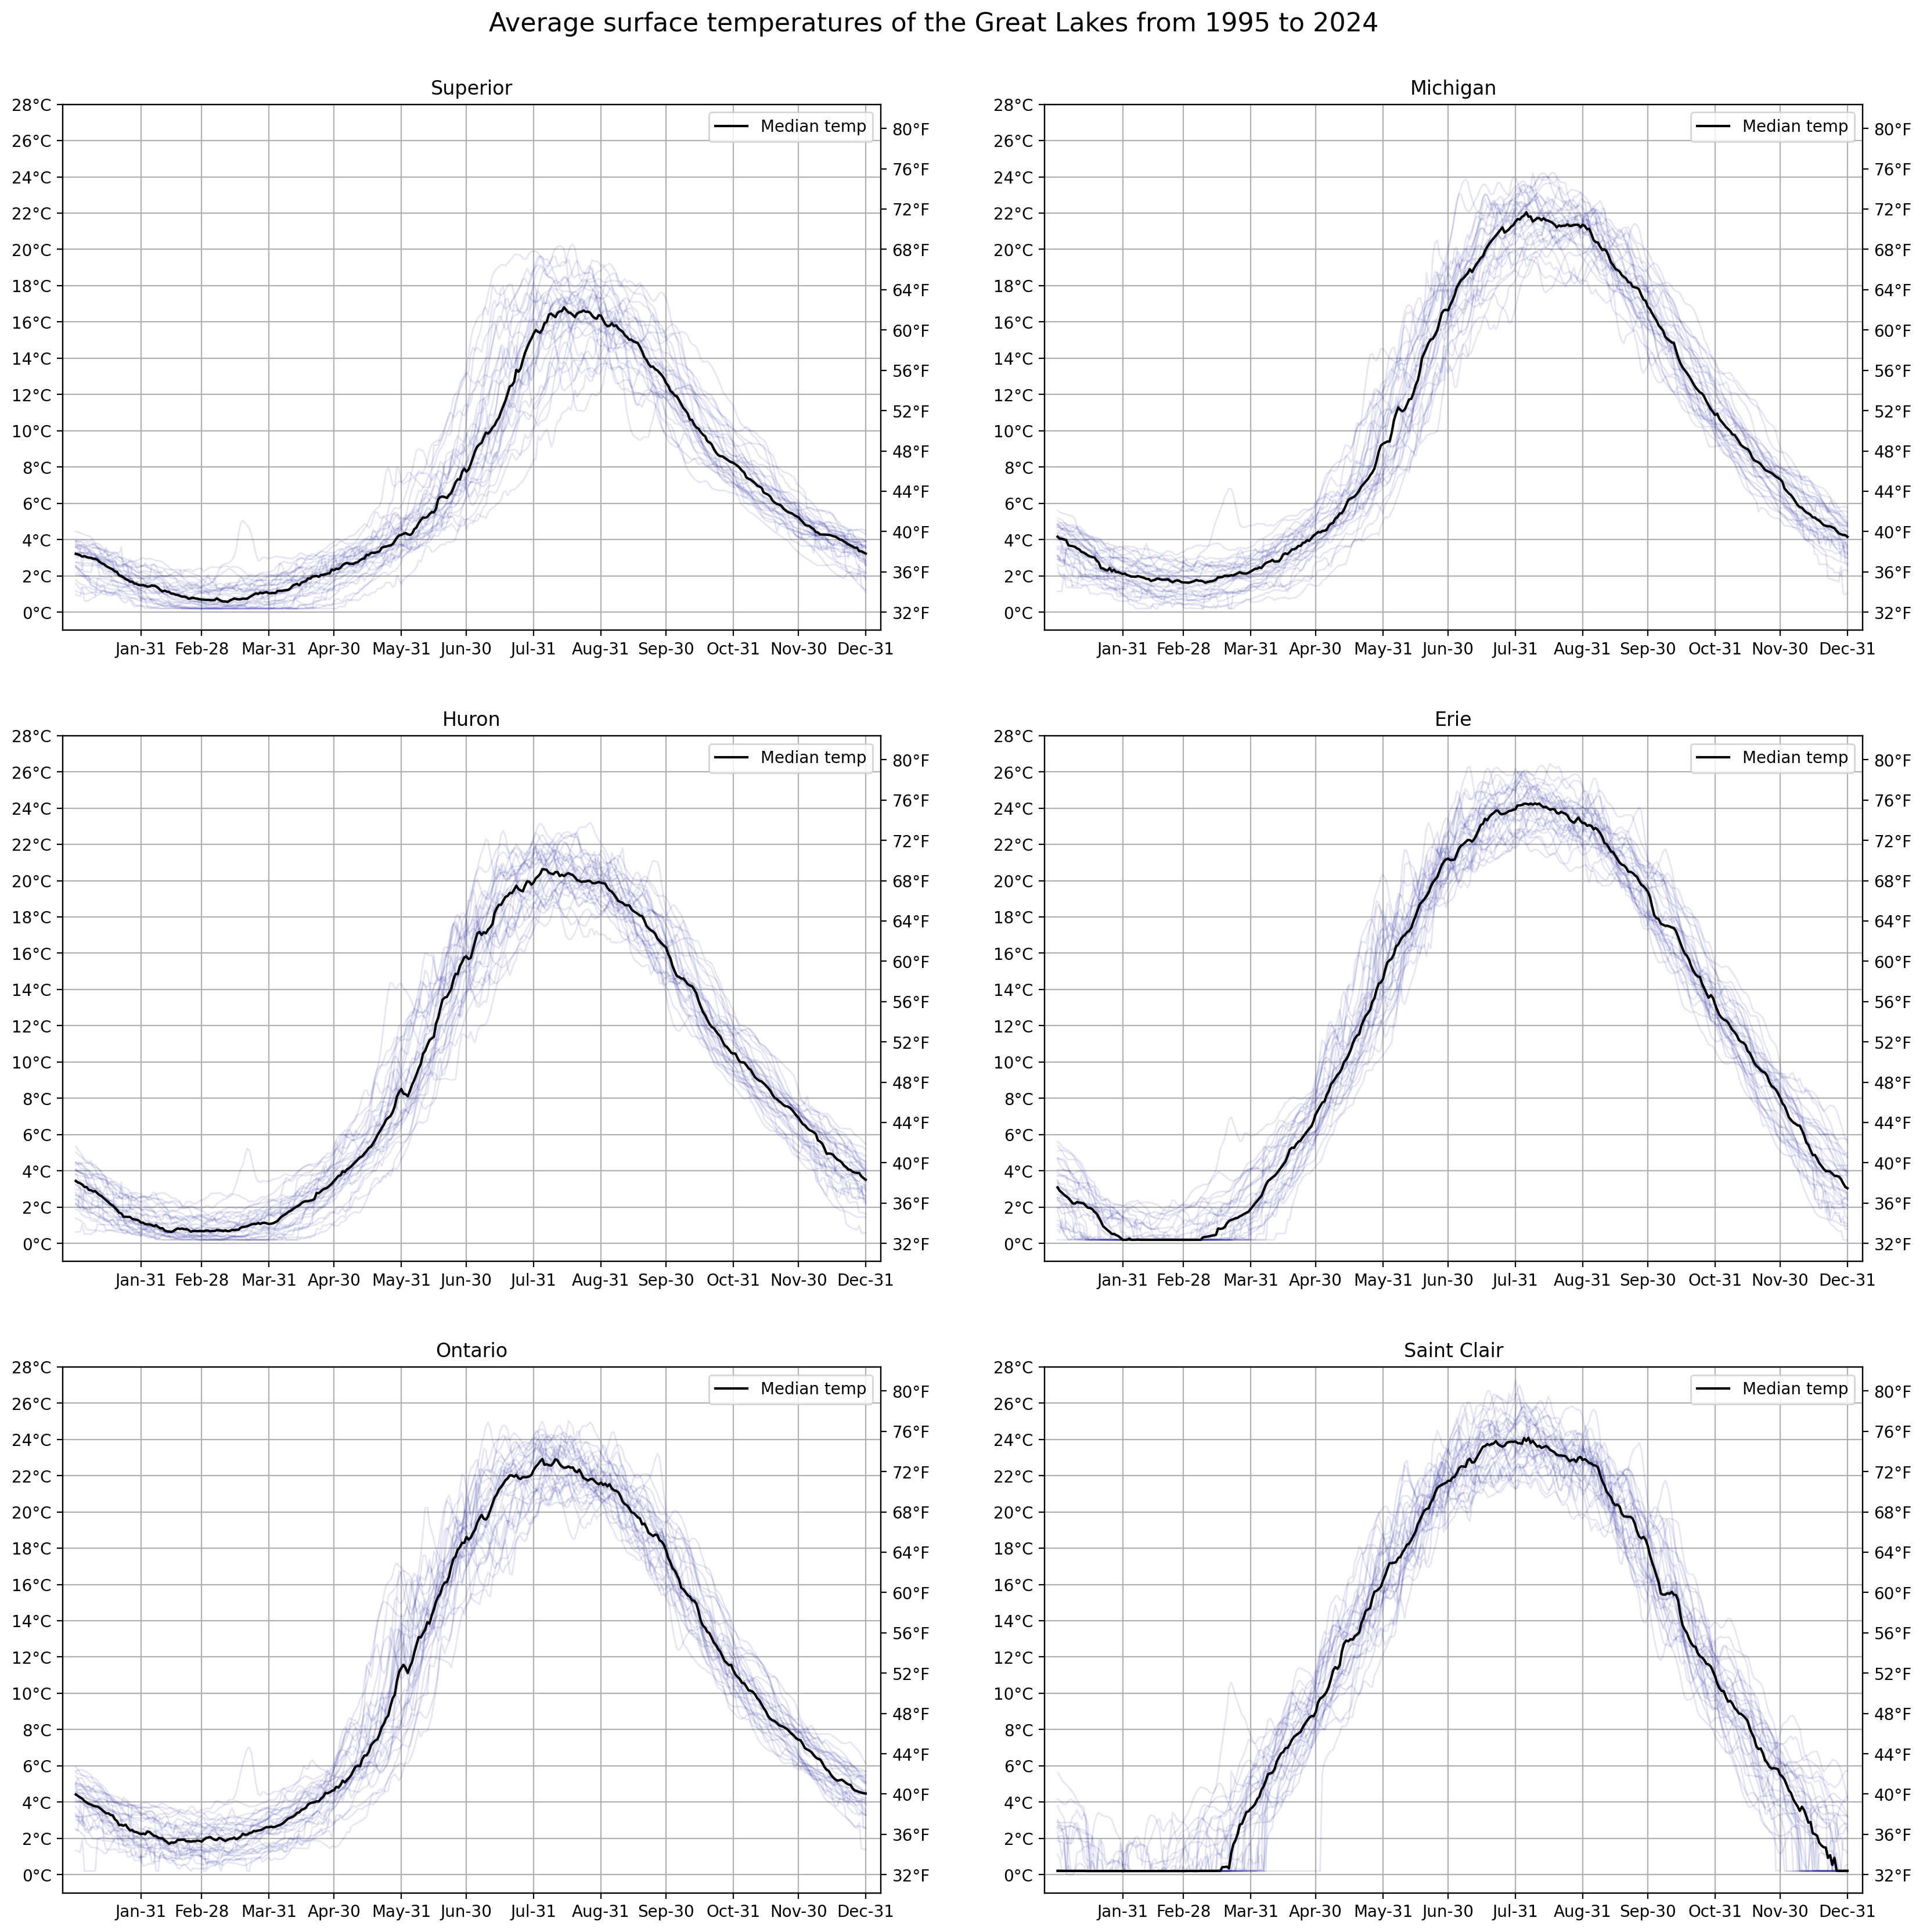
Using again the Great Lakes temperature data from this website, which you used already in previous homework, make a figure which is as close as you can make it to the figure shown below, displaying the daily average temperatures from 1995 to 2024 for the five Great Lakes as well as Lake St. Clair.
This time use Python!
The data files can be downloaded from here.
Tips:
- If
dris a string giving the directory holding the data files, use the following commands to make a Python list of all the data files. This will help you read them all in in a convenient way.
from os import listdir
files = pd.Series(listdir(dr))
dat_files = files[files.str.match('.*.dat')] - As before, just get rid of leap-day data so that each year has 365 days. You do not need to treat dates as real dates.