Make this plot in R
$$
$$
Before making a trip to Lake Superior over the summer of 2025 I was wondering how warm the water would be. In my research I stumbled across a plot like the one below (which I accessed more recently on August 11, 2025 while creating this homework assignment).
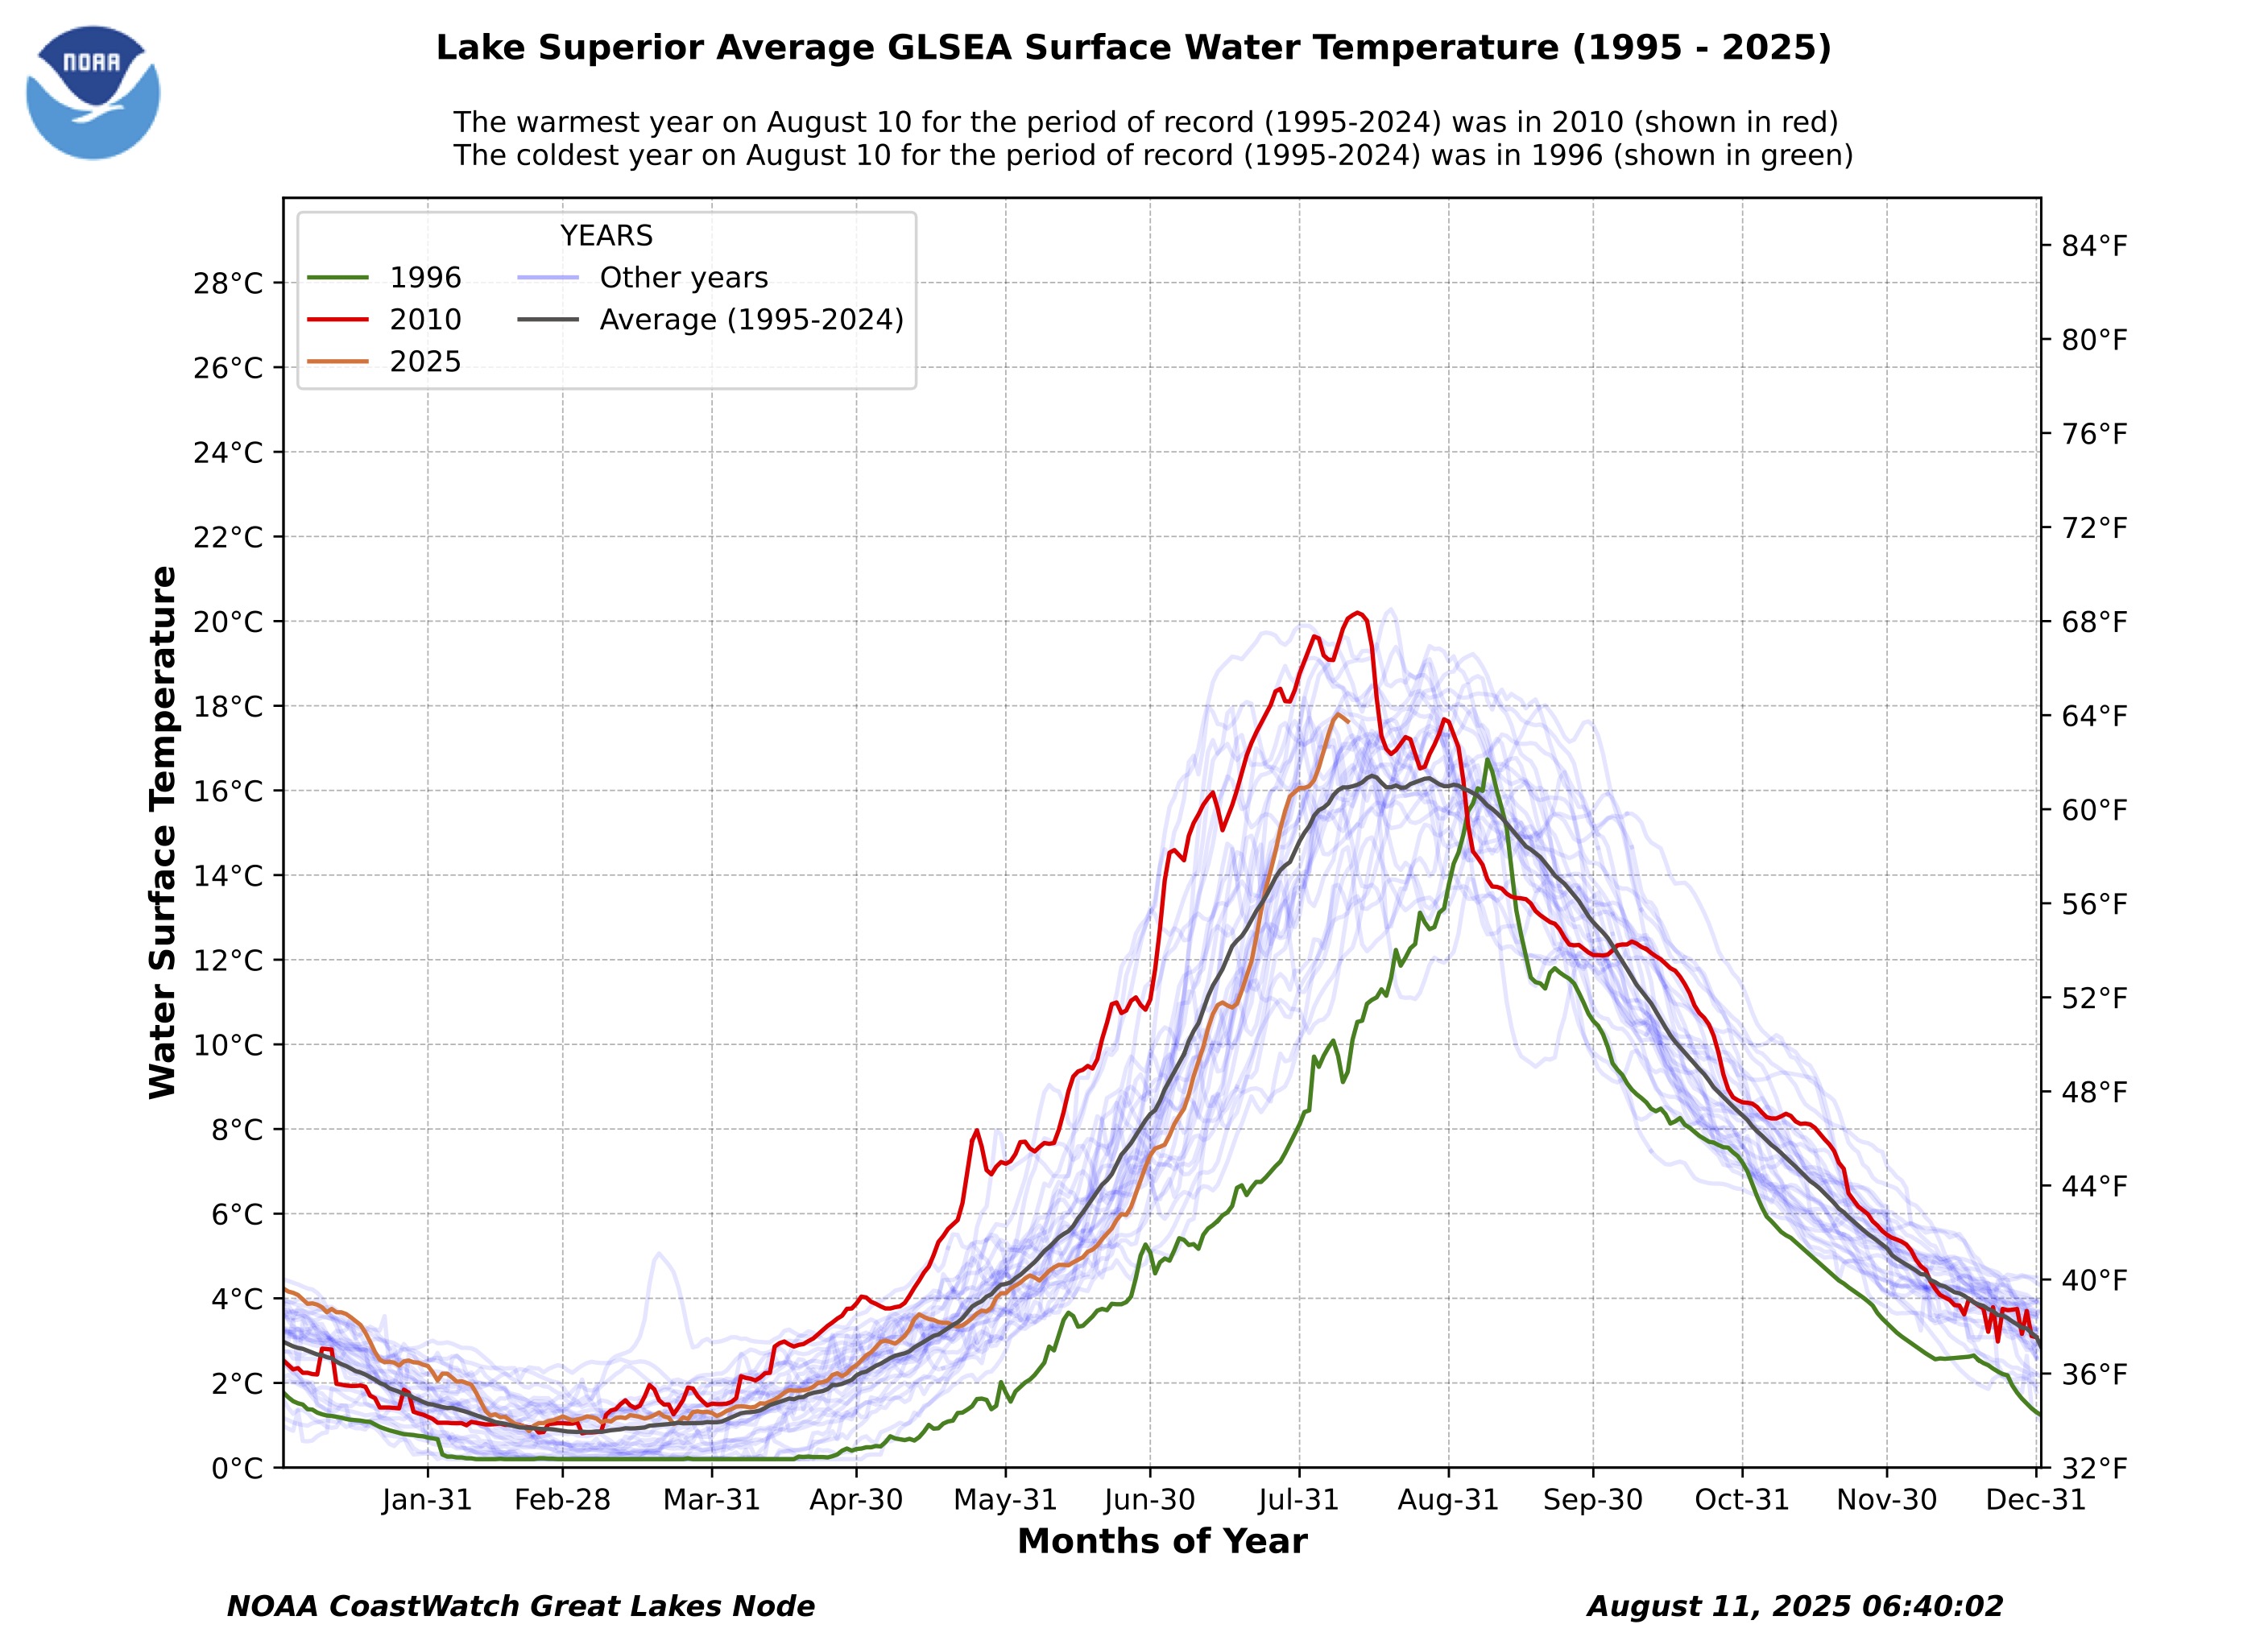
The plot shows the daily average temperatures over the years 1995-2024 as well as for the part of 2025 through August 10 (the day before I accessed it). Each daily temperature is some kind of average temperature across the surface of the lake.
This site makes available the daily temperature data on which the plot is based. This is what the links to the data files look like on the website (scroll all the way down):
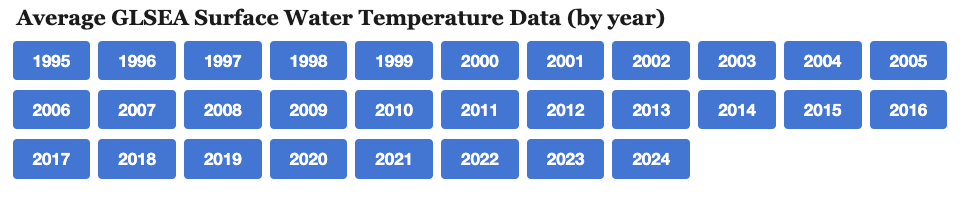 Alternatively, you can get the data files from my GitHub page here.
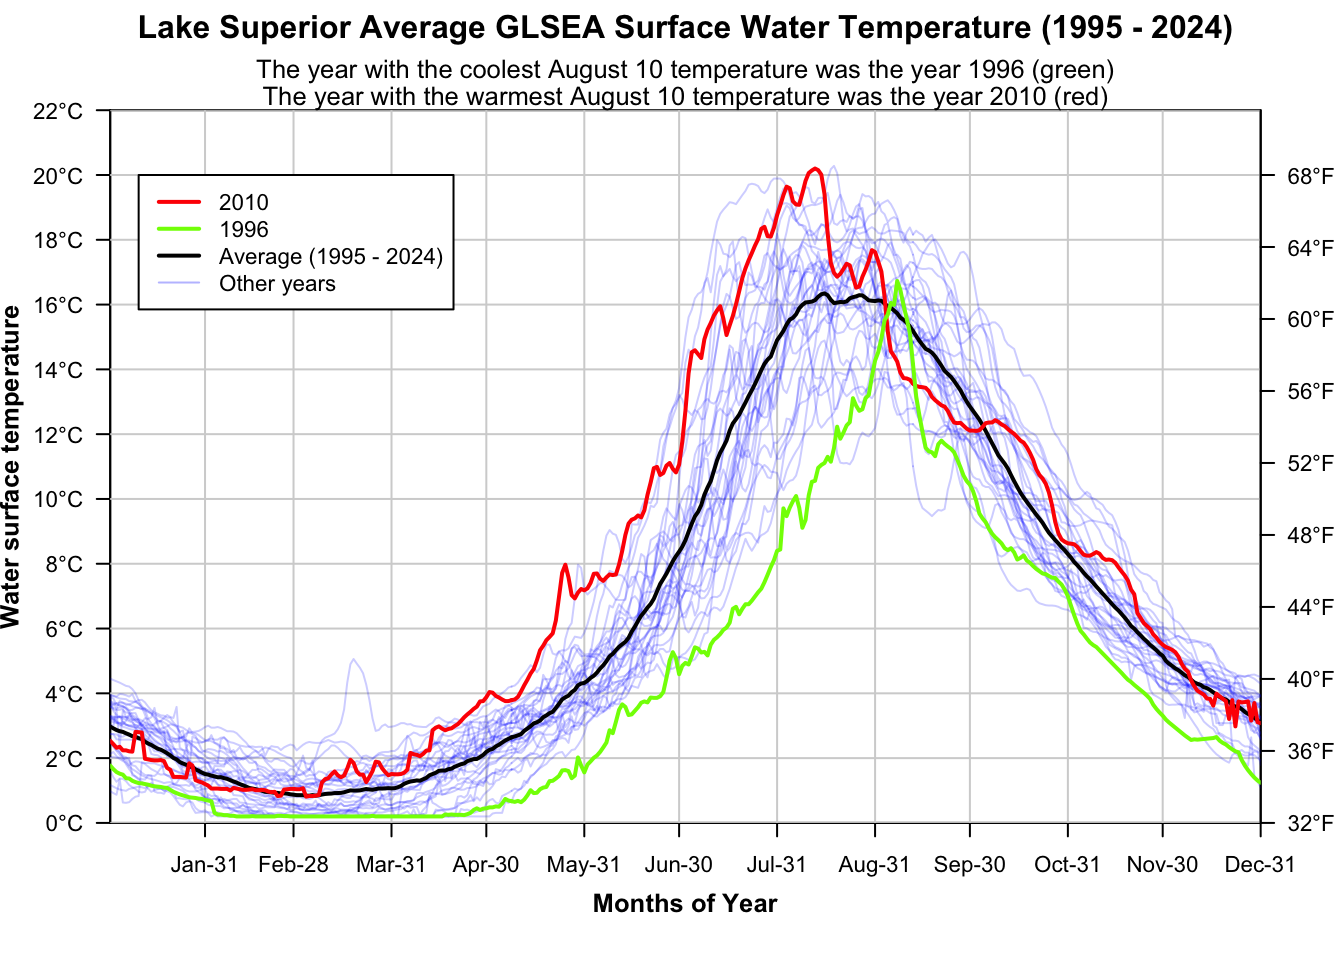
Ignoring the partial data for the year 2025, your assignment is to use R to reproduce from the raw data files the above plot as closely and in as much detail as you can. Below is my own rendition. You may use some discretion to make minor changes (for example I changed the upper limit of the vertical axis to 22 degrees celcius because I thought the original plot had too much empty space at the top).
Tips:
To handle the presence of leap days on leap years, just remove leap days and treat each year as though it had 365 days. Moreover, don’t bother treating the dates in these data as as actual dates.
If you have a bunch of data files sitting in a folder and you want to import all of them, a nice way to do it is to get a vector containing all the names of the files (and then you can write a loop for reading them in!). The commands below will create a vector containing the names of all the “.dat” files in the current working directory.
files <- list.files(getwd())       # list all files in current working directory
dat <- files[grep(".dat",files)]   # select only those with extension .dat
References
“Average Surface Water Temperature — Coastwatch.glerl.noaa.gov.” https://coastwatch.glerl.noaa.gov/statistics/average-surface-water-temperature-glsea/.